COVID-19 situation update for the EU/EEA and the UK, as of 6 July 2020
The data presented on this page has been collected between 6:00 and 10:00 CET
Disclaimer: National updates are published at different times and in different time zones. This, and the time ECDC needs to process these data, may lead to discrepancies between the national numbers and the numbers published by ECDC. Users are advised to use all data with caution and awareness of their limitations. Data are subject to retrospective corrections; corrected datasets are released as soon as processing of updated national data has been completed.
As of 06 July 2020, 1 552 352 cases have been reported in the EU/EEA and the UK: United Kingdom (285 416), Spain (250 545), Italy (241 611), Germany (196 554), France (166 960), Sweden (71 419), Belgium (62 016), Netherlands (50 566), Portugal (43 897), Poland (35 950), Romania (28 973), Ireland (25 527), Austria (18 269), Denmark (12 832), Czechia (12 515), Norway (8 895), Finland (7 253), Bulgaria (5 740), Luxembourg (4 522), Hungary (4 183), Greece (3 519), Croatia (3 151), Estonia (1 993), Iceland (1 863), Lithuania (1 836), Slovakia (1 764), Slovenia (1 700), Latvia (1 124), Cyprus (1 003), Malta (672) and Liechtenstein (84).
As of 06 July 2020, 178 152 deaths have been reported in the EU/EEA and the UK: United Kingdom (44 220), Italy (34 861), France (29 893), Spain (28 385), Belgium (9 771), Germany (9 016), Netherlands (6 118), Sweden (5 420), Romania (1 750), Ireland (1 741), Portugal (1 614), Poland (1 517), Austria (706), Denmark (606), Hungary (589), Czechia (348), Finland (329), Norway (251), Bulgaria (246), Greece (192), Croatia (113), Slovenia (111), Luxembourg (110), Lithuania (79), Estonia (69), Latvia (30), Slovakia (28), Cyprus (19), Iceland (10), Malta (9) and Liechtenstein (1).
| EU/EEA and the UK | Sum of Cases | Sum of Deaths | Reported cases per 100 000 population | Reported deaths per 100 000 population |
|---|---|---|---|---|
| United_Kingdom | 285416 | 44220 | 429.3 | 66.5 |
| Spain | 250545 | 28385 | 536.2 | 60.8 |
| Italy | 241611 | 34861 | 399.8 | 57.7 |
| Germany | 196554 | 9016 | 237.0 | 10.9 |
| France | 166960 | 29893 | 249.2 | 44.6 |
| Sweden | 71419 | 5420 | 701.3 | 53.2 |
| Belgium | 62016 | 9771 | 542.9 | 85.5 |
| Netherlands | 50566 | 6118 | 293.5 | 35.5 |
| Portugal | 43897 | 1614 | 426.9 | 15.7 |
| Poland | 35950 | 1517 | 94.7 | 4.0 |
| Romania | 28973 | 1750 | 148.8 | 9.0 |
| Ireland | 25527 | 1741 | 525.9 | 35.9 |
| Austria | 18269 | 706 | 206.5 | 8.0 |
| Denmark | 12832 | 606 | 221.3 | 10.5 |
| Czechia | 12515 | 348 | 117.8 | 3.3 |
| Norway | 8895 | 251 | 167.4 | 4.7 |
| Finland | 7253 | 329 | 131.4 | 6.0 |
| Bulgaria | 5740 | 246 | 81.7 | 3.5 |
| Luxembourg | 4522 | 110 | 744.1 | 18.1 |
| Hungary | 4183 | 589 | 42.8 | 6.0 |
| Greece | 3519 | 192 | 32.8 | 1.8 |
| Croatia | 3151 | 113 | 77.1 | 2.8 |
| Estonia | 1993 | 69 | 150.9 | 5.2 |
| Iceland | 1863 | 10 | 526.9 | 2.8 |
| Lithuania | 1836 | 79 | 65.8 | 2.8 |
| Slovakia | 1764 | 28 | 32.4 | 0.5 |
| Slovenia | 1700 | 111 | 82.2 | 5.4 |
| Latvia | 1124 | 30 | 58.3 | 1.6 |
| Cyprus | 1003 | 19 | 84.3 | 1.6 |
| Malta | 672 | 9 | 139.0 | 1.9 |
| Liechtenstein | 84 | 1 | 221.6 | 2.6 |
| Total | 1552352 | 178152 |
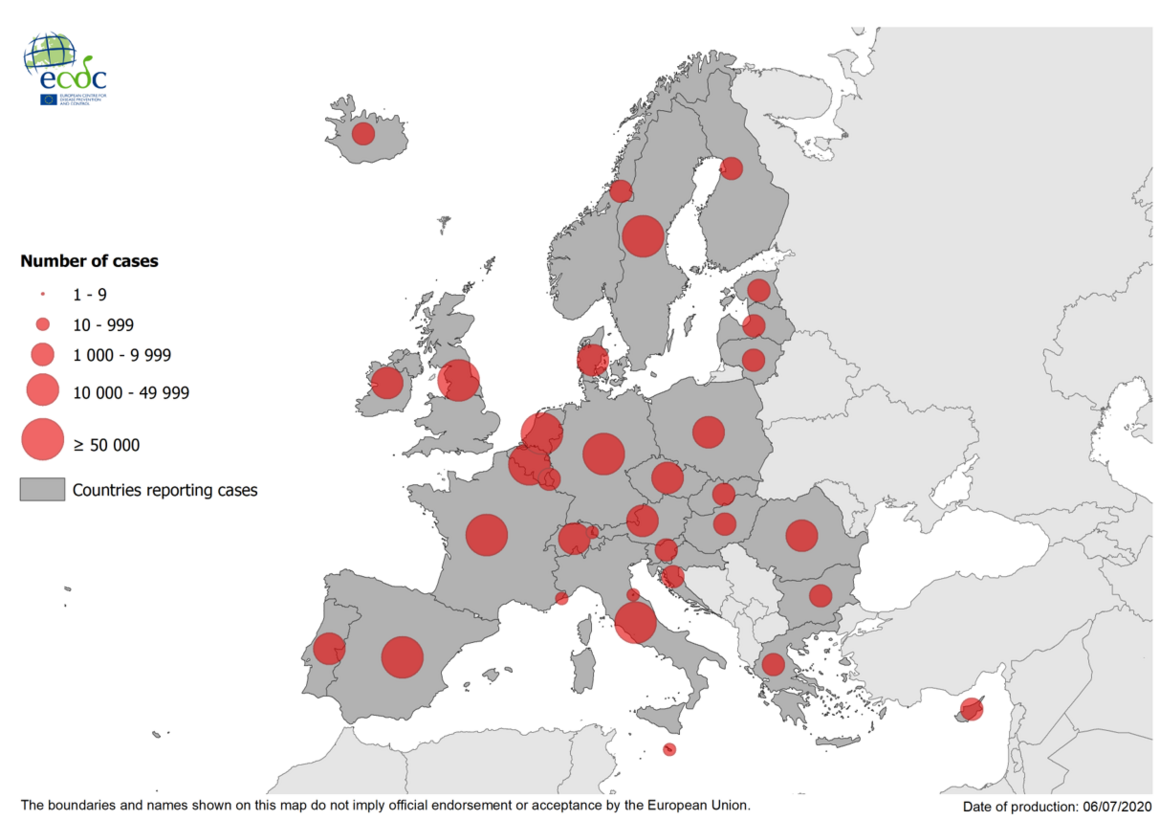
Distribution of laboratory confirmed cases of COVID-19 in the EU/EEA and the UK, as of 6 July 2020

On 3 July the UK announced an ongoing revision of historical data that lead to a negative number of new cases and an overall decrease in cases for the UK.
Geographic distribution of COVID-19 in the EU/EEA and the UK, as of 6 July 2020
More data resources
Download today’s data on the geographic distribution of COVID-19 cases worldwide
Situation dashboard - COVID-19 cases in Europe and worldwide
The interface allows users to explore and interact with latest available data on COVID-19 and switch chart to tables view for details. The situation dashboard now includes more detailed data on cases from the EU/EEA and the UK.
The number of cases and deaths can be shown within a specific date range and by country. Enhanced data is available on a subset of cases and includes age, gender, hospitalisation and admission to intensive care. Please note that the boundaries and names shown on this dashboard do not imply official endorsement or acceptance by the European Union.
The data shown are updated on daily basis (see the date of the latest update in the footnote). Some features might not work in Internet Explorer, so please use another browser.