COVID-19 situation update for the EU/EEA and the UK, as of 31 August 2020
The data presented on this page has been collected between 6:00 and 10:00 CET
Disclaimer: National updates are published at different times and in different time zones. This, and the time ECDC needs to process these data, may lead to discrepancies between the national numbers and the numbers published by ECDC. Users are advised to use all data with caution and awareness of their limitations. Data are subject to retrospective corrections; corrected datasets are released as soon as processing of updated national data has been completed.
How is the data collected? Sources: EU/EEA and UK data Sources: Worldwide data Interpretation of the data
As of 31 August 2020, 2 196 336 cases have been reported in the EU/EEA and the UK: Spain (439 286), United Kingdom (334 467), France (277 943), Italy (268 218), Germany (242 381), Romania (86 785), Belgium (84 948), Sweden (83 958), Netherlands (70 071), Poland (66 870), Portugal (57 768), Ireland (28 760), Austria (27 218), Czechia (24 367), Denmark (16 700), Bulgaria (16 190), Norway (10 543), Greece (10 134), Croatia (10 123), Finland (8 077), Luxembourg (6 625), Hungary (5 961), Slovakia (3 876), Lithuania (2 874), Slovenia (2 865), Estonia (2 373), Iceland (2 105), Malta (1 862), Cyprus (1 487), Latvia (1 393) and Liechtenstein (108).
As of 31 August 2020, 181 592 deaths have been reported in the EU/EEA and the UK: United Kingdom (41 499), Italy (35 477), France (30 606), Spain (29 011), Belgium (9 894), Germany (9 298), Netherlands (6 215), Sweden (5 821), Romania (3 578), Poland (2 033), Portugal (1 819), Ireland (1 777), Austria (733), Denmark (624), Hungary (614), Bulgaria (613), Czechia (423), Finland (335), Norway (264), Greece (262), Croatia (184), Slovenia (128), Luxembourg (124), Lithuania (86), Estonia (64), Latvia (34), Slovakia (33), Cyprus (21), Malta (11), Iceland (10) and Liechtenstein (1).
*On 28 August 2020, Cyprus reported less cases resulting in a negative number. Data will be updated as soon as it is made available.
As of 24 August 2020, Authorities in Luxembourg report COVID-19 cases and deaths from their resident population only. Therefore, the difference with the figure from 27 August is translated into a negative value for the cases and deaths reported on 28 August 2020
From 24 August, Monaco only reported figures among residents resulting in a drop in cases and deaths.
| EU/EEA and the UK | Sum of Cases | Sum of Deaths | 14-day cumulative number of COVID-19 cases per 100 000 | 14-day cumulative number of COVID-19 deaths per 100 000 |
|---|---|---|---|---|
| Spain | 439 286 | 29 011 | 205.5 | 0.8 |
| United_Kingdom | 334 467 | 41 499 | 24.0 | 0.2 |
| France | 277 943 | 30 606 | 88.7 | 0.3 |
| Italy | 268 218 | 35 477 | 23.7 | 0.1 |
| Germany | 242 381 | 9 298 | 21.3 | 0.1 |
| Romania | 86 785 | 3 578 | 84.1 | 3.0 |
| Belgium | 84 948 | 9 894 | 53.5 | 0.6 |
| Sweden | 83 958 | 5 821 | 23.4 | 0.1 |
| Netherlands | 70 071 | 6 215 | 41.2 | 0.3 |
| Poland | 66 870 | 2 033 | 26.8 | 0.4 |
| Portugal | 57 768 | 1 819 | 35.7 | 0.4 |
| Ireland | 28 760 | 1 777 | 30.6 | 0.1 |
| Austria | 27 218 | 733 | 43.4 | 0.1 |
| Czechia | 24 367 | 423 | 40.9 | 0.2 |
| Denmark | 16 700 | 624 | 18.7 | 0.1 |
| Bulgaria | 16 190 | 613 | 26.1 | 1.6 |
| Norway | 10 543 | 264 | 13.0 | 0.1 |
| Greece | 10 134 | 262 | 28.5 | 0.3 |
| Croatia | 10 123 | 184 | 87.1 | 0.4 |
| Finland | 8 077 | 335 | 6.3 | 0.0 |
| Luxembourg | 6 625 | 124 | -132.6 | 0.2 |
| Hungary | 5 961 | 614 | 10.7 | 0.1 |
| Slovakia | 3 876 | 33 | 17.9 | 0.0 |
| Lithuania | 2 874 | 86 | 16.4 | 0.2 |
| Slovenia | 2 865 | 128 | 21.6 | 0.2 |
| Estonia | 2 373 | 64 | 13.8 | 0.1 |
| Iceland | 2 105 | 10 | 26.3 | 0.0 |
| Malta | 1 862 | 11 | 94.6 | 0.4 |
| Cyprus | 1 487 | 21 | 17.7 | 0.1 |
| Latvia | 1 393 | 34 | 3.7 | 0.1 |
| Liechtenstein | 108 | 1 | 39.1 | 0.0 |
| Total | 2196336 | 181592 | NA | NA |
Distribution of laboratory confirmed cases of COVID-19 in the EU/EEA and the UK, as of 31 August 2020

14-day COVID-19 case notification rate per 100 000, weeks 33-34
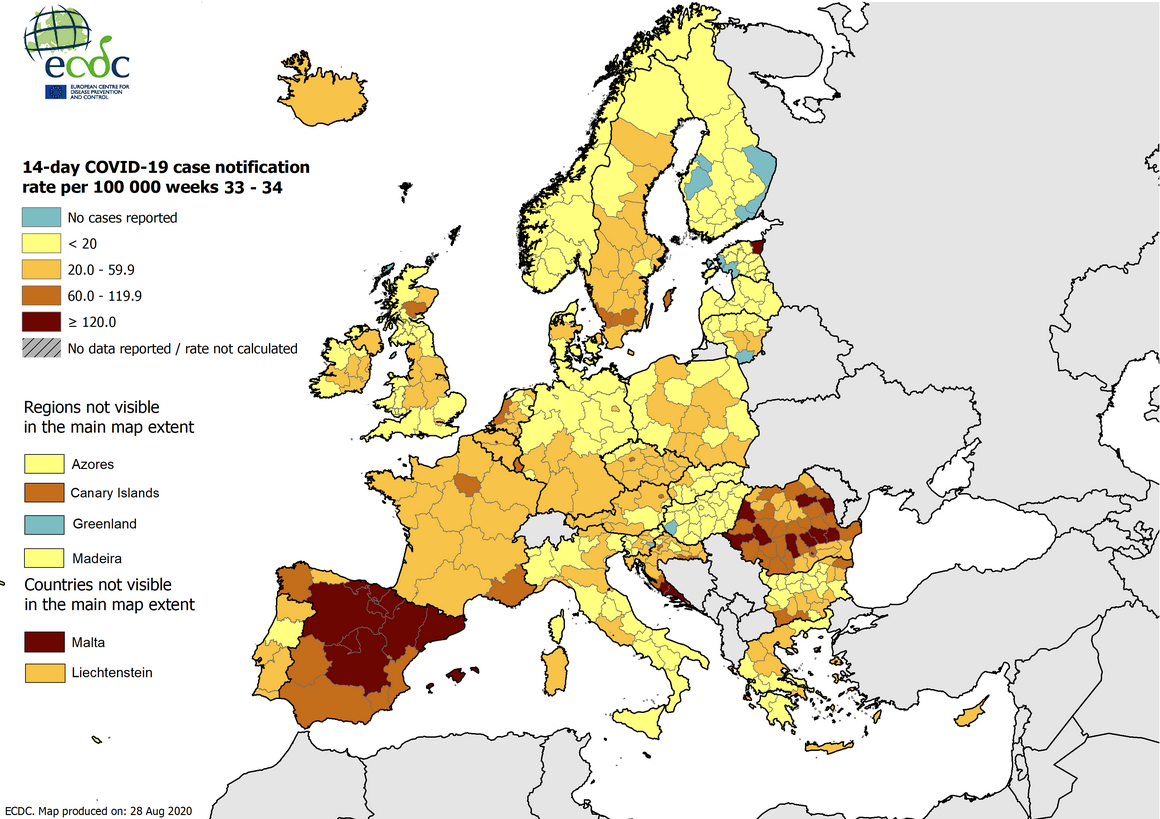
Disclaimer: This map, showing cases at sub-national level, is based on data recorded once a week. Therefore, the time frame for this map and the national table above is not the same, which can result in different values in the table and the map.
More data resources
Download today’s data on the geographic distribution of COVID-19 cases worldwide
Situation dashboard - COVID-19 cases in Europe and worldwide
The interface allows users to explore and interact with latest available data on COVID-19 and switch chart to tables view for details. The situation dashboard now includes more detailed data on cases from the EU/EEA and the UK.
The number of cases and deaths can be shown within a specific date range and by country. Enhanced data is available on a subset of cases and includes age, gender, hospitalisation and admission to intensive care. Please note that the boundaries and names shown on this dashboard do not imply official endorsement or acceptance by the European Union.
The data shown are updated on daily basis (see the date of the latest update in the footnote). Some features might not work in Internet Explorer, so please use another browser.