COVID-19 situation update for the EU/EEA and the UK, as of week 50 2020
ECDC switched to a weekly reporting schedule for the COVID-19 situation worldwide and in the EU/EEA and the UK on 17 December 2020. Hence, all daily updates have been discontinued from 14 December. ECDC will publish updates on the number of cases and deaths reported worldwide and aggregated by week every Thursday. The weekly data will be available as downloadable files in the following formats: XLSX, CSV, JSON and XML. As an exception, the weekly updates for the end-of-year festive season will be published on 23 December and 30 December 2020.
Data presented on this page are collected between Monday and Wednesday for the preceding week and published on Thursdays
Disclaimer: National updates are published at different times and in different time zones. This, and the time ECDC needs to process these data, may lead to discrepancies between the national numbers and the numbers published by ECDC. Users are advised to use all data with caution and awareness of their limitations. Data are subject to retrospective corrections; corrected datasets are released as soon as processing of updated national data has been completed.
How are the data collected? Sources: EU/EEA and UK data Sources: Worldwide data Interpretation of the data
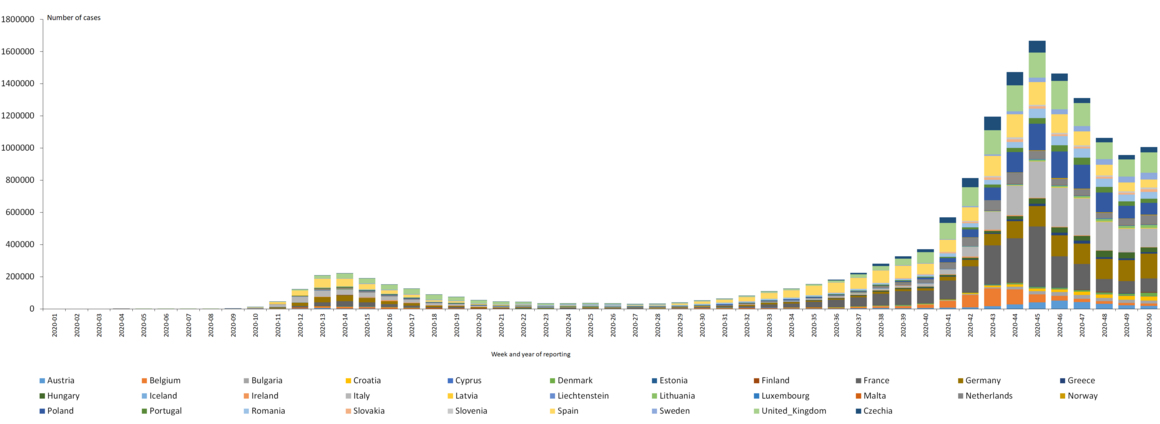
As of week 2020-50, 15 130 100 cases have been reported in the EU/EEA and the UK: France (2 376 852), United Kingdom (1 849 403), Italy (1 843 712), Spain (1 751 884), Germany (1 337 078), Poland (1 135 676), Netherlands (612 746), Belgium (611 284), Czechia (581 079), Romania (556 335), Portugal (348 744), Sweden (341 029), Austria (320 036), Hungary (283 870), Bulgaria (179 449), Croatia (175 886), Slovakia (132 984), Greece (124 534), Denmark (109 758), Slovenia (96 314), Lithuania (95 021), Ireland (76 185), Luxembourg (41 272), Norway (41 003), Finland (30 810), Latvia (25 675), Estonia (18 055), Cyprus (15 101), Malta (11 254), Iceland (5 557) and Liechtenstein (1 514).
As of week 2020-50, 375 930 deaths have been reported in the EU/EEA and the UK: Italy (64 520), United Kingdom (64 170), France (57 911), Spain (48 013), Poland (22 864), Germany (21 975), Belgium (18 170), Romania (13 385), Netherlands (10 034), Czechia (9 609), Sweden (7 667), Hungary (7 130), Bulgaria (5 688), Portugal (5 559), Austria (4 400), Greece (3 625), Croatia (2 640), Ireland (2 124), Slovenia (1 459), Slovakia (1 175), Denmark (941), Lithuania (825), Finland (461), Luxembourg (396), Norway (393), Latvia (349), Malta (174), Estonia (149), Cyprus (78), Iceland (28) and Liechtenstein (18).
| EU/EEA and the UK | Sum of Cases | Sum of Deaths | 14-day case notification rate per 100 000 inhabitants for the reporting period | 14-day death notification rate per 100 000 inhabitants for the reporting period | Reporting period YYYY-WW |
|---|---|---|---|---|---|
| France | 2376852 | 57911 | 236.3 | 8.3 | 2020-49 and 2020-50 |
| United_Kingdom | 1849403 | 64170 | 348.2 | 8.9 | 2020-49 and 2020-50 |
| Italy | 1843712 | 64520 | 428.3 | 15.9 | 2020-49 and 2020-50 |
| Spain | 1751884 | 48013 | 220.9 | 6.3 | 2020-49 and 2020-50 |
| Germany | 1337078 | 21975 | 341.1 | 6.9 | 2020-49 and 2020-50 |
| Poland | 1135676 | 22864 | 396.6 | 15.4 | 2020-49 and 2020-50 |
| Netherlands | 612746 | 10034 | 546.7 | 4.0 | 2020-49 and 2020-50 |
| Belgium | 611284 | 18170 | 263.0 | 11.5 | 2020-49 and 2020-50 |
| Czechia | 581079 | 9609 | 576.1 | 13.8 | 2020-49 and 2020-50 |
| Romania | 556335 | 13385 | 436.8 | 11.3 | 2020-49 and 2020-50 |
| Portugal | 348744 | 5559 | 524.9 | 11.0 | 2020-49 and 2020-50 |
| Sweden | 341029 | 7667 | 781.7 | 4.3 | 2020-49 and 2020-50 |
| Austria | 320036 | 4400 | 472.5 | 16.9 | 2020-49 and 2020-50 |
| Hungary | 283870 | 7130 | 683.0 | 23.6 | 2020-49 and 2020-50 |
| Bulgaria | 179449 | 5688 | 528.0 | 26.8 | 2020-49 and 2020-50 |
| Croatia | 175886 | 2640 | 1208.8 | 22.8 | 2020-49 and 2020-50 |
| Slovakia | 132984 | 1175 | 500.0 | 6.6 | 2020-49 and 2020-50 |
| Greece | 124534 | 3625 | 189.3 | 12.2 | 2020-49 and 2020-50 |
| Denmark | 109758 | 941 | 523.7 | 1.9 | 2020-49 and 2020-50 |
| Slovenia | 96314 | 1459 | 1006.0 | 25.6 | 2020-49 and 2020-50 |
| Lithuania | 95021 | 825 | 1205.9 | 11.4 | 2020-49 and 2020-50 |
| Ireland | 76185 | 2124 | 80.4 | 1.5 | 2020-49 and 2020-50 |
| Luxembourg | 41272 | 396 | 1189.0 | 14.7 | 2020-49 and 2020-50 |
| Norway | 41003 | 393 | 117.4 | 1.2 | 2020-49 and 2020-50 |
| Finland | 30810 | 461 | 112.0 | 1.2 | 2020-49 and 2020-50 |
| Latvia | 25675 | 349 | 453.1 | 7.9 | 2020-49 and 2020-50 |
| Estonia | 18055 | 149 | 453.1 | 2.8 | 2020-49 and 2020-50 |
| Cyprus | 15101 | 78 | 538.6 | 3.4 | 2020-49 and 2020-50 |
| Malta | 11254 | 174 | 304.3 | 8.3 | 2020-49 and 2020-50 |
| Iceland | 5557 | 28 | 49.3 | 0.6 | 2020-49 and 2020-50 |
| Liechtenstein | 1514 | 18 | 628.0 | 7.8 | 2020-49 and 2020-50 |
| Total | 15130100 | 375930 | 15343.3 | 314.7 |
Distribution of laboratory-confirmed cases of COVID-19 in the EU/EEA and the UK, as of week 50
14-day COVID-19 case notification rate per 100 000, weeks 49-50
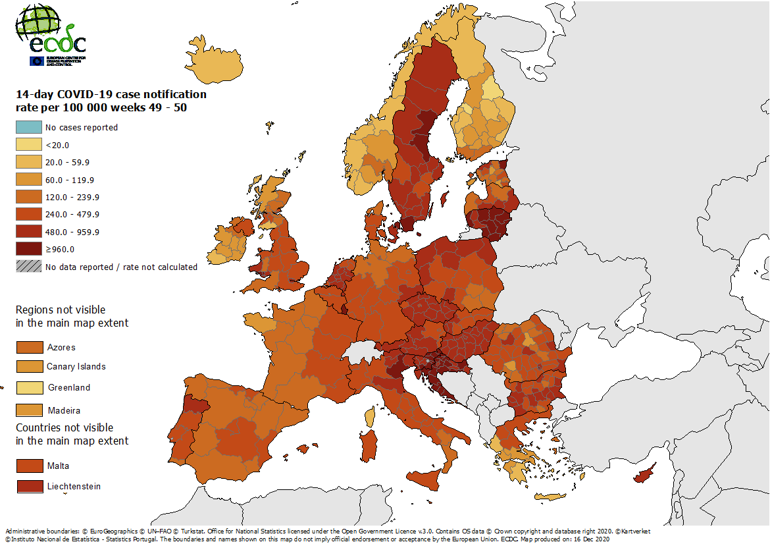
Disclaimer: This map, showing cases at sub-national level, is based on data recorded once a week. Therefore, the time frame for this map and the national table above is not the same, which can result in different values in the table and the map.