Primary Exposures by Week

This report is updated daily at approximately 1:00 p.m. Information on COVID-19 cases changes rapidly, and this report may not reflect updates made after 1:00 p.m. by local health departments or health care systems.
Report Date: May 18, 2020
7384
Total COVID-19 Cases
174022
Total Reported People Tested
595
Total COVID-19 Hospitalizations
80
Total COVID-19 Deaths
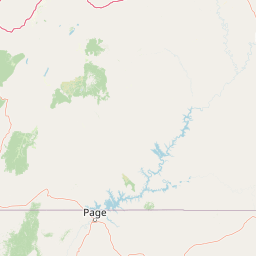
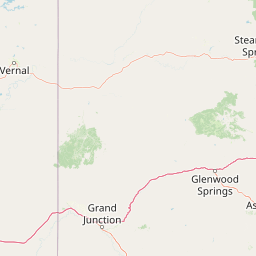
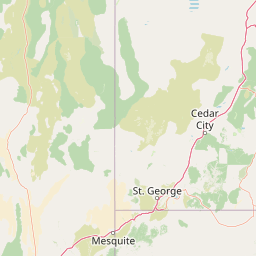
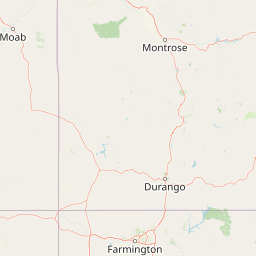
The below map shows the crude case rate per 100,000 people per Utah Small Area. Crude case rates show the number of COVID-19 cases in an area given its population. Case rates may be higher or lower depending on the age of people living in a small area and how much testing has occurred there. Small areas with low populations may have disproportionately high or low rates depending on few cases and the number of tests performed in an area. A high rate in an area does not necessarily indicate a current outbreak because rates are calculated from the beginning of the pandemic. “Utah Small Areas” are geographic areas with population sizes ranging from about 8,000 to 86,000. Small areas were created by UDOH and local health departments to assess health data and policies. More information on Utah Small Areas can be found at: ibis.health.utah.gov.

* The number of recovered persons is estimated by the number of cases whose first positive laboratory test was reported at least 21 days ago, excluding deaths.
Laboratory: As of March 19th, 2020 all major private and public laboratories in Utah are reporting positive and negative COVID-19 (SARS-CoV-2) results to UDOH. Positive cases are reported immediately. Negative results may have up to a 72-hour lag before being reported and results prior to March 19th may be under-reported. Laboratory positives may not match confirmed cases due to ongoing investigations and confirmatory testing. When available, laboratory data is shown by the date a sample was tested. If unavailable, it is shown by the date reported to public health.
Case data: As of April 15th, case data are displayed by both the date the first positive laboratory result (FPLR) is reported to public health and the self-reported symptom onset date. Previously this was reported by the first day a person was reported (through laboratory results or contact tracing) to public health. The FPLR date will provide a more stable estimate of the new cases reported to public health, however, there will be small differences in cases by date as public health receives additional information. Onset date is taken preferentially from the following dates when available: 1) self-reported date of first symptoms, 2) date diagnosed by a clinician, 3) date first positive specimen was collected, 4) first report to public health. The actual number of cases in Utah is higher than what is reported due to mild cases not feeling ill enough to seek care, clinician judgement for testing, and expanding laboratory capacity.
Data for this report were accessed on May 18, 2020 08:29 AM.
Cases are interviewed by public health to determine what potential medical risk factors they may have had prior to getting COVID-19. This is not a complete list of conditions and rates may change as public health collects more data and performs additional analysis. Examples of persons with compromised immune systems include those with cancer and transplant patients who are taking certain immunosuppressive drugs, persons with HIV/AIDS, and those with inherited diseases that affect the immune system. Examples of persons with chronic pulmonary conditions include those with uncontrolled asthma or COPD.
Exposures are determined through LHD and UDOH case investigations. Each case is mapped to a single “primary exposure”. Please note that some cases have multiple potential exposures, so cases are mapped to exposures in the following order: 1) Known close contact to a confirmed case, 2) Travel in the past 14 days, 3) Healthcare (either through being a healthcare worker, patient, or visitor in a healthcare setting), 4) In-state transmission with no known contacts, 5) Under investigation. In-state transmission with no known contacts is defined as a patient with no known out of state travel, close contacts, or healthcare exposures. These exposures are commonly referred to as community spread or community transmission.
Known exposures are further broken down by type (green pie chart). “Social” refers to exposures between friends and acquaintances; “Other” refers to known contact with a lab confirmed case outside of home, work, and social settings; “Unspecified” is known contact to a confirmed case but without enough information to determine the setting of that exposure. Exposure categories are not all encompassing and may change as public health collects more data and updates analysis.
Through a partnership with the Utah Hospital Association, hospitals in Utah self-report the number of COVID-19 cases currently in their facilities each day. The data below provide a snapshot of the number of people with COVID-19 who are currently hospitalized. If a report from a facility is not receivedin a given day, the report from the previous day will be used. Due to differences in reporting systems, these numbers should not be compared to the cumulative hospitalization data identified through public health investigations.
| Satewide COVID-19 Hospital Survey Data | |
|---|---|
| Number of patients currently hospitalized for confirmed COVID-19 | 98 |
| Patients currently hospitalized as COVID-19 persons under investigation | 81 |
| Facilities using prior day data | 29 |
Hospitalizations included below represent the total number of cases that have been admitted to hospitals. This count does not represent the number of COVID-19 cases currently in the hospital. Hospitalization data is collected from patient interviews and medical chart abstractions by Local Health Departments (LHDs). While UDOH and LHDs capture most hospitalizations through provider reporting, some patients may be hospitalized after the case was investigated by an LHD and therefore not included in this count. Hospitalizations by age may not sum to total hospitalizations because some cases are initially reported without complete age data. Due to differences in reporting systems, these numbers should not be compared to the daily hospitalization data collected through hospital reporting.
| Hospitalization | Case Count | % of Investigated Cases |
|---|---|---|
| Yes | 595 | 8.5% |
| No | 6401 | 91.5% |
| Under Investigation | 388 | — |
| ICU | Case Count | % of Investigated Cases |
|---|---|---|
| Yes | 197 | 2.8% |
| No | 6722 | 97.2% |
| Under Investigation | 465 | — |
| Intubated/Ventilator Use | Case Count | % of Investigated Cases |
|---|---|---|
| Yes | 84 | 1.3% |
| No | 6474 | 98.7% |
| Under Investigation | 826 | — |
One way to look at how quickly COVID-19 is spreading in Utah is the number of new hospital admissions every day. Hospitalizations are less dependent on testing than case counts. Admission dates are obtained through public health investigations and not all new hospitalization dates are reported if a case had previously been investigated by public health. The plot below shows the number of laboratory confirmed cases reported by admission date (blue bars).
The below table presents a variety of summary statistics about deaths associated with COVID-19 in Utah. The pre-existing conditions included are those on the “Risk Factors & Exposures” tab (cardiovascular, chronic pulmonary, diabetes, immunocompromised, chronic kidney, chronic liver, neurological, current smoking, former smoking, and other).
High Risk: at least 65 years of age and/or having at least one pre-existing condition.
Demographic data: There will be small count differences in data presented by age groups, self-reported sex, and hospitalization status. This is because some cases are not initially reported with all of these data elements and unknowns are excluded from this report. Case data will be updated as local health departments (LHDs) and the Utah Department of Health (UDOH) complete investigations.
Race & Ethnicity: Race and ethnicity groups follow US Census estimates for race alone or in combination in order to provide a broad snapshot of Utah’s growing diversity, including the many multi-racial and multi-ethnic individuals who call Utah home. Groups are not mutually exclusive and will not sum to total.
The two-week cumulative incidence rate summarizes new cases reported in the past 14 days per 100,000 people. It looks at the recent burden of cases in an area given its population. Areas with elevated incidence rates will have a higher burden of ill people who may be infectious and/or currently accessing healthcare.
The current epidemic curve looks at how the trend in cases is changing over time and assigns a trend category to each day, based on whether the three-day daily average of cases is increasing, staying stable, or decreasing. It is calculated by using the daily case incidence rate per 100,000 people (bars), finding the three-day moving average of daily incidence rates (grey points), fitting a smoothed curve to these incidence rates (grey line), and looking at the slope of that curve (colors on the bars). If the slope of the curve is above 0, incidence is increasing. If the slope is about zero, incidence is holding stable (a plateau). If the slope is decreasing after at least 5 days of plateau, incidence is decreasing.
Please note: Recent increases or decreases in testing can lead to changes in daily incidence. Epidemic curve status can fluctuate from day to day so trends need to be interpreted cautiously and in conjunction with other surveillance data.